Working Paper Number 13/05
Evaluating Latin America’s Commodity Dependence on China Economic Analysis Hong Kong, January, 2013
13/05 Working Paper Hong Kong, January 2013
Evaluating Latin America’s Commodity Dependence on China Authors: Matt Ferchen, Alicia Garcia-Herrero and Mario Nigrinis 1 TPF
FPT
January 2013
Abstract During the last decade, China’s growing economic importance has been considered a blessing for South America, given their still relatively high dependence on the US and commodity exports. However, this positive sentiment is starting to change. Concerns are being raised about potential adverse effects of Chinese demand for raw materials and “excessive” imports of cheap manufactured goods as substitutes of domestic production. In other words, there is a growing fear about extreme export concentration and, in turn, de-industrialization. We explore to what extent South America has become “Sinodependent” and the implications of such dependency. To that end, we create a dependency index and then assess the implications of high Chinese GDP growth rates on South American performance over the last decade. We focus on four countries (Brazil, Argentina, Chile and Peru) and four commodities (iron ore, soy, copper, and ores of non-ferrous metals). We find that each of the countries analyzed has become more exposed to Chinese demand for the commodities in question. In fact, in the past ten years, exposure to Chinese demand measured by our weighted dependency index has risen. This is much more the case for some specific countries and products such as Argentinean soy, Brazilian iron ore and soy, and Chilean copper exports. Despite this increased exposure, we find that Chinese demand has added less than 1 percentage point to GDP growth rates in these four economies in the last years. Although this contribution may be considered bellow expectations, there are secondary effects from the production and export of these commodities not fully captured by the statistics. For any given commodity, there are likely to be spin-off effects in that for any given country, one or two commodities may function as an important engine driving the domestic economy. In turn, any downturn in demand, especially if tied directly to China, would have negative implications beyond the marginal effect on GDP growth that we have calculated here. The combination of hopes and anxieties tied to South America’s decade-long boom in economic relations with China is likely to persist. The honeymoon period of South AmericaChina economic relations may or may not be over, but what is clear is that commodities will continue to underpin the relationship for better or for worse.
Keywords: Commodity exports, Latin America, China, Dependence. JEL: F14, F15, F41, F50.
1: Thank you for Carrie Weiwei Liu and Mariana Silva for their research assistance. T
T
Page 2
Working Paper Hong Kong, January 2013
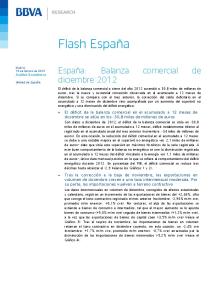
1. Introduction During the last decade, the world has been in the midst of a global commodity boom largely explained by China’s hunger for raw materials to feed its rapid development and industrialization. Latin America, among other commodity-rich regions, has benefitted from higher prices and larger orders for its exports. In return, China is exporting massive amounts of manufactured goods to Latin America. All in all, trade has increased by a factor greater than 20 in both directions, although the highest growth has been in the exports of the Southern Cone and Andean countries into China. Such exports have been concentrated in mineral, agricultural and energy commodities (see chart 1). Thus China has quickly emerged as the number one or two trading partner and export market for a number of these countries. Overall, China’s arrival to South America has been considered a blessing in a region very much dependent on the US and with most of its exports concentrated in commodities (see chart 2). However, this positive sentiment is starting to change. Concerns are being raised about potential adverse effects of Chinese demand for raw materials and “excessive” imports of cheap manufactured goods, which substitute for domestic production. In other words, there is a growing fear about extreme export concentration and, in turn, de-industrialization. Chart 1
Chart 2
Commodity exports to China (% of total exports to China)
US, EU and China: Total imports from South America* (in USD billion)
90% 80% 70% 60% 50% 40% 30% 20% 10% 0%
300 250 200 150
Source: UN Comtrade
Commodities
2010
2009
2008
2007
2006
2005
2004
2003
CHI-copper
PER-ores non fer
2002
BRA-iron ore
2010
0
2001
BRA-soy
50
2000
ARG-soy
2008
2006
2004
2002
2000
1998
1996
1994
1992
1990
100
Non commodities
Source: UN Comtrade
This report assesses these concerns by analyzing the effect of Chinese demand on South American commodity exports. In other words, we explore the basic question of to what extent this region has become “Sinodependent” and the implications of such dependency by determining if there has been a change in the vulnerabilities and sources of risk for selected South American economies. In particular, we focus on four countries (Brazil, Argentina, Chile and Peru) and four commodities (iron ore, soy, copper, and ores of non-ferrous metals) by using statistics from the COMTRADE database. Based on these countries and commodities we create a dependency index and then assess the implications high Chinese GDP growth rates have had on South American performance over the last decade plus. We find that in the last decade, each of the countries analyzed has become more exposed to Chinese demand for the commodities in question (Chile-copper and ores of non-ferrous metals, Argentina-soy, Brazil-iron ore and soy, and Peru-ores of non-ferrous metals and copper). In fact, in the last ten years, exposure to Chinese demand in our weighted dependency index demonstrates clear increases, most markedly in the case of Argentinean soy, Brazilian iron ores and soy, and Chilean copper exports. Despite this increased exposure, we find that dynamic Chinese demand has added less than 1 percentage point to GDP growth rates in these four economies in the last years. We conclude with some final observations on how this relative exposure stacks up in comparison with other commodity-exporting countries and Page 3
Working Paper Hong Kong, January 2013
during other cycles of global commodity boom and bust. Ultimately, we find that South American exposure to the Chinese commodity boom implies a mixed blessing as the region’s commodity exporting powerhouses find their fates increasingly tied into the vicissitudes of Chinese economic growth.
2. Historical commodity market shifts: copper, iron ore, soy and ores of non ferrous metals China’s demand for South American resources took off a decade ago (see chart 3) as the country’s economic model shifted toward heavy industrial production, the private property market exploded, and wealthier citizens demanded a richer diet. The focus of global commodity markets shifted away from the US and Europe towards China (see chart 4), which rapidly became the world’s largest consumer of dozens of commodities, including iron ore, copper, soybeans and ores of non ferrous metals. China became the biggest contributor both to global commodity demand and to global commodity prices. Chart 4
Total imports from South America* (in USD billion)
Chart 3
Exports to China (% of total export) 30
120
25
100
20
80
15
60
10
40
5
20
Argentina
Brazil
Chile
Peru
Source: UN Comtrade
CN
EU
2010
2009
2008
2007
2006
2005
2004
2003
2002
2001
0 2000
2010
2008
2006
2004
2002
2000
1998
1996
1994
1992
1990
0
US
Source: UN Comtrade
Charts 5 and 6 use Gini coefficients to measure export and import market concentration for soy beans, iron ore, copper and ores of non ferrous metals over the period from 1962-2010 (Table 1 provides more details). These charts provide a clear historical picture of what has changed, and what has not, in global demand and supply for these commodities in question.
Page 4
Working Paper Hong Kong, January 2013
Chart 5
Chart 6
Market concentration by world importers (Gini index)
Copper
Iron Ores
Soybean
Ores Non Ferrous
Source: UN Comtrade
Copper Soybean
2010
2006
2002
1998
1994
1990
1986
1982
1978
1974
1970
1.00 0.98 0.96 0.94 0.92 0.90 0.88 0.86 0.84 0.82 0.80 1966
2010
2006
2002
1998
1994
1990
1986
1982
1978
1974
1970
1966
1962
1.00 0.98 0.96 0.94 0.92 0.90 0.88 0.86 0.84 0.82 0.80
1962
Market concentration by world exporters (Gini index)
Iron Ores Ores Non Ferrous
Source: UN Comtrade
Table 1
Historical Commodity Trends Top exporters and importers in some commodity markets 1962-1970 1971-1980 1981-1990 Exporters Share Exporters Share Exporters Share US 96.7 US 83.9 US 76.7 Brazil 1.8 Brazil 9.6 Brazil 8.9 Canada 0.8 Argentina 4.5 Argentina 7.6 Soybean Importers Share Importers Share Importers Share Japan 29.1 Japan 22.0 Japan 20.6 Germany 19.0 Germany 18.5 Netherlands 13.0 Spain 7.8 Netherlands 11.6 Germany 12.2
Iron ore
Copper
Ores non ferrous
1991-2000 Exporters Share US 65.3 Brazil 17.0 Argentina 7.5 Importers Share Japan 15.6 Netherlands 11.9 Germany 9.5
2001-2010 Exporters Share US 46.6 Brazil 31.1 Argentina 11.6 Importers Share China 45.2 Japan 6.6 Netherlands 5.3
2010 Exporters Share US 47.7 Brazil 28.3 Argentina 12.8 Importers Share China 58.0 Japan 4.2 Mexico 3.7
1962-1970 Exporters Share Sweden 22.8 Canada 20.4 Venezuela 7.3 Importers Share Japan 31.2 US 19.7 Germany 17.3
1971-1980 Exporters Share Australia 20.3 Brazil 18.4 Canada 16.5 Importers Share Japan 37.7 Germany 15.3 US 13.3
1981-1990 Exporters Share Brazil 31.3 Australia 25.3 Canada 14.8 Importers Share Japan 36.6 Germany 13.7 USA 7.3
1991-2000 Exporters Share Brazil 32.9 Australia 27.9 Canada 9.2 Importers Share Japan 26.9 Germany 11.0 China 10.4
2001-2010 Exporters Share Australia 37.6 Brazil 26.9 India 9.1 Importers Share China 52.8 Japan 13.3 Korea 4.9
2010 Exporters Share Australia 43.4 Brazil 28.3 India 6.0 Importers Share China 60.5 Japan 11.6 Rep. Korea 5.0
1962-1970 Exporters Share Chile 20.2 Bel-Lux 12.7 US 9.2 Importers Share Germany 15.7 UK 14.2 US 14
1971-1980 Exporters Share Chile 16.4 Bel-Lux 11.3 Zambia 10.5 Importers Share Germany 14.4 France 11.0 US 10.6
1981-1990 Exporters Share Chile 17.1 Germany 14.3 Bel-Lux 10.1 Importers Share Germany 12.6 USA 11.7 France 9.8
1991-2000 Exporters Share Chile 14.6 Germany 11.0 Japan 6.9 Importers Share US 10.0 Germany 9.8 France 7.1
2001-2010 Exporters Share Chile 19.7 Germany 9.1 Japan 5.9 Importers Share China 18.2 USA 9.5 Germany 7.7
2010 Exporters Share Chile 22.0 Germany 8.2 Japan 6.4 Importers Share China 27.5 Germany 7.1 US 6.6
1962-1970 Exporters Share Canada 30.3 Austrilia 8.7 US 7.6 Importers Share Japan 22.0 US 20.1 UK 11.2
1971-1980 Exporters Share Canada 22.6 Austrilia 10.0 US 7.2 Importers Share Japan 29.3 Germany 13.0 US 12.7
1981-1990 Exporters Share Canada 18.6 Austrilia 12.1 US 8.5 Importers Share Japan 28.5 US 9.8 Germany 9.3
1991-2000 Exporters Share Chile 14.5 Canada 12.8 Indonesia 12.1 Importers Share Japan 26.0 US 7.4 Germany 6.4
2001-2010 Exporters Share Chile 21.1 Austrilia 11.4 Indonesia 10.6 Importers Share China 24.0 Japan 19.0 Korea 8.3
2010 Exporters Share Chile 19.8 Peru 12.3 Australia 12.3 Importers Share China 32.7 Japan 17.6 Korea 8.4
Source: UN Comtrade
Page 5
Working Paper Hong Kong, January 2013
•
In the case of soybeans, global export concentration has decreased slightly over the period in question, but two producers (the USA and Brazil) have been responsible for more than 80% of total world exports for the last four decades. Since the 1970s, Argentina has consistently been in third position in terms of global soy exports. However, Brazil has increased its global share of exports more than threefold over that time. On the demand side, import concentration steadily fell from its peak in the 1960s, bottoming out in the 1990s, only to pick up again later that decade. Change in Chinese demand is largely responsible for this increase in soybean market demand concentration. Ten years ago, China’s policy of soybean self-sufficiency helped keep its share of global demand to just 6%. But as millions of more Chinese citizens demanded unfatty milk with their fatty pork, China abandoned its self-sufficiency policy and turned to world soy markets. Today China gobbles more than half of the world’s soybeans, and soybean prices have surged more than threefold over the past decade. What this picture shows then is that for both Brazil and Argentina, China has rapidly emerged as the most important market for their soy exports but with Brazil occupying a much larger share of total global soy exports than Argentina. (Charts 7 and 8 below demonstrate the way in which China has clearly emerged as the key destination for both Brazilian and Argentine soy).
•
In terms of the market for iron ore, global export concentration has increased as Australia and Brazil have expanded their combined share of global exports from just below 40% in the 1970s to over 65% in the last decade. Moreover, within those two supplier countries, only three firms dominate the market for iron ore production and exports: Vale, Rio Tinto and BHP Billiton. On the import side, and as with soy, market concentration decreased from the 1960s through the late 1990s, after which a China-led surge in demand contributed to increasing demand concentration. And just as with soy, the last decade has seen China leapfrog past traditionally dominant importers (in this case Japan and Germany) to become the number one importer of iron ore, now occupying more than half of global demand. While China’s rising demand for soy was tied to the increased commercialization of pork and chicken production, the dramatic spike in demand for iron ore was tied to the rapid development of China’s domestic steel industry that has fed into booming property and infrastructure development. The end result is that Brazil’s iron ore exports are now tied into Chinese demand in a way hardly imaginable just a decade ago (Chart 9 below demonstrates this dramatic shift).
Chart 7
Chart 8
90%
70%
80%
60%
Argentina: exports of soybean to main partners (Share, %)
70%
Brazil: exports of soybean to main partners (Share, %)
50%
60% 50%
40%
40%
30%
30%
China Source: UN Comtrade
Netherlands
China
2010
2007
2004
2001
1998
1995
1992
1989
1986
1980
2010
2007
2004
2001
1998
1995
1992
1989
0%
1986
0% 1983
10%
1980
10%
1983
20%
20%
Netherlands
Source: UN Comtrade
Page 6
Working Paper Hong Kong, January 2013
Chart 9
Brazil: exports of iron ores to main partners (Share, %) 60%
Chart 10
Chile: exports of copper to main partners (Share, %)
China Source: UN Comtrade
Germany
China
2010
2007
2004
2001
1998
2010
2007
2004
2001
1998
1995
1992
1989
1986
1983
1980
0%
1995
10%
1992
20%
1989
30%
1986
40%
1983
50%
1980
45% 40% 35% 30% 25% 20% 15% 10% 5% 0%
US
Source: UN Comtrade
•
The exports of ores of non ferrous metals are less concentrated when comparing with iron ores and soy, although the current Gini level is similar to the one observed during the 60’s. Australia has always been one of the largest exporters while Chile became the largest one in the last two decades. Peru became a relevant player only until recent years. On the demand side, imports seem to be as concentrated as in the case of iron ore and soy. Once again the emergence of China as a world player is the main driver behind this trend and nowadays is the largest buyer worldwide.
•
In the market for copper, both supply and demand are more dispersed than the markets for either soy, iron ore or ores of non ferrous metals. On the supply side, market concentration decreased steadily from the 1970s until last year when it scored the lowest reading during the whole sample. But for the last 50 years Chile has maintained its position as the world’s largest copper exporter, with Germany an increasingly distant. The demand side for copper is also less concentrated than for soy or iron ore, but here too China has tripled its share of the market in the last decade to become the world’s largest importer at nearly 30%. As with China’s rising demand for iron ore, China’s booming demand for copper has been driven by the country’s rapid expansion of property and infrastructure. And just as in the case of soy and iron ore, China has replaced traditional importing powerhouses like the United States and to become the largest marginal source of demand growth (see Chart 10).
Page 7
Working Paper Hong Kong, January 2013
3. China and Latin American Commodity exports: measuring dependency How vulnerable are Latin American commodity exporters to shifts in Chinese demand? To measure this, we have created a “China export dependency index” as indicated below 2 . TP
Indexi, j =3
EXPi, j EXP to China × EXP j EXPi, j
i, j
F
FPT
⎡ IMPi,China ⎛ EXPi, j ⎞⎤ ×avg ⎢ , ⎜1− ⎟⎥ IMP EXP i i ⎠⎦⎥ ⎝ ⎣⎢
The index is a geometric mean of three components:
EXPi, j
=
Country j’s exports of commodity i as a share of its total exports. This shows how concentrated are a country exports into one commodity (i).
=
Country j’s exports of commodity i to China divided by its total export of that commodity. This shows how dependent the world is on China to sell a particular commodity relative to other export markets.
=
The average of 2 components:
EXP j EXP to China
i, j
EXPi, j ⎡ IMP i,China , avg ⎢⎢ IMP i ⎣⎢
⎛ ⎜1 − ⎜ ⎝
EXP EXP
i, j i
⎤ ⎞⎥ ⎟ ⎟⎥ ⎠⎥ ⎦
IMPi,China IMPi
is the share of China’s imports of commodity i in the global market. ⎛ ⎜1 − ⎜ ⎝
EXP EXP
i, j i
⎞ ⎟ ⎟ ⎠
is 1 minus country j’s export market share of
commodity i. This provides a measure of China’s strength as a buyer or pricing power compared to the exporting country’s strength as a seller. The index is scaled from 0 (no dependence) to 1 (complete dependence). The index is a relative measure of export dependence on China for each country and its particular commodity. The higher the score, the more vulnerable any exporter will be to any disruption of trade with China (see Chart 11).
2: We have conducted robustness tests with similar formulae. The index is to measure the vulnerability of a particular sector rather than the whole economy.
Page 8
Working Paper Hong Kong, January 2013
Chart 11
Exports dependency to China index (0 no dependency - 1 absolute dependency) 0.7 0.6 0.5 0.4 0.3 0.2 0.1
Oil 2002
Iron Ore
Copper
Ores non ferrous metals
Soybean
Coal
Indonesia
Malaysia
Australia
Indonesia
USA
Brazil
Argentina
Indonesia
Australia
S. Africa
Chile
Peru
Japan
Peru
Chile
S. Africa
Brazil
Australia
Russia
S. Arabia
Angola
0.0
Palm oil
2010
Source: UN Comtrade
The index shows that dependency on Chinese demand for all the commodities considered in the sample have increased compared with year 2002. It is also clear Angolan oil has the highest need of Sino purchases. In the cases of iron ore, copper, ores of non ferrous metals and soy bean, dependency is higher than the cases of coal or palm oil. With the exception of iron ore, the four Latin American countries are more reliant on Chinese demand than the other exporters, for instance US in the case of soy beans, or Australia and Indonesia concerning ores of non ferrous metals. Regarding iron ore, Brazilian exports are less dependent on China than Australian. Although Australia is the largest world exporter, hence has the larger leverage to bargain prices, iron ore accounts for almost 25% of its total exports and China is its most important buyer with a 70% of the total purchases of this commodity. On the other hand, South African iron ore total exports are less important (below 8% of total exports), but its market share is just above 5% while sales to China account for almost 65% of their total iron ore exports. Brazil is in the middle of both previous cases. Exports of this commodity are almost 15% of it total exports, it is the second largest world exporter and Chinese demand accounts for less than half of the whole sales of iron ore to the world. In the case of copper, Chilean exports have the advantage of having the largest market power 3 and a smaller demand from China who buys “less than” 40% of their total commodity exports, offsetting the importance of copper for the Austral economy 4 . For the case of Peru, its negligible market power (less than 4% of world copper exports) is offset by its exports lower reliance on this commodity (11.2% of total exports) and the minor sales to China (20.6% of their total copper exports). Japan’s feeble market power (their share of copper world exports is less than 7%) and the fact that China purchases more than 90% of all their commodity external sales explains their vulnerability to the Sino economy, although copper exports are less than 1% of their total exports. TPF
TPF
FPT
FPT
Among exports of ores of non ferrous metals, the Peruvian are the most sensitive to Chinese demand. This is a very interesting market where Chile has the largest share of total exports, whereas Peru, Australia and Indonesia have a similar market power. The main difference among these economies is the relevance exports of this commodity have for Peru, being its largest export and representing almost 35% of their total. At the same time, Peruvian sales of these ores to China are almost a third of its total sales. South African ores of non ferrous metals are the third most dependent, given its low market power (their share is less than 6% of world
3: Chile has been the largest world exporter of copper for the last five decades. 4: In 2010 copper exports were 38.9% of total Chilean exports. T
T
T
T
Page 9
Working Paper Hong Kong, January 2013
exports) and the fact that China is the destination of more than 40% of total exports of this commodity, despite its lower relevance on total South African exports 5 . TPF
FPT
Within the South American economies in the sample, Argentinean soybean exports are among the most dependent on Chinese demand both because China takes an extremely high share of its total soy exports (83%) and because Argentina’s soybean market power is extremely weak, as Argentina accounts for less than 13% of world supply, compared to US (48%) and Brazil (28%). Argentina’s dependence on Chinese demand was dramatically exposed in 2009 when China cut off all imports of Argentinean soy in a bilateral trade dispute. China’s position as the dominant importer meant that it enjoyed a great deal of leverage through imposing the block on soy imports from Argentina. Brazil’s soybean producers remain highly dependent on China, but slightly less so than their Argentinean competitors, thanks to their stronger market position; the former also applies for the US who is the world largest soy bean exporter. Political factors may help to mitigate some of the economic risk of Brazilian exporters’ dependency on China. While both Brazil and Argentina have been designated “strategic partners” by China, it is clear that China views its political ties with Brazil in a different category than with any other country in the region. Joint Chinese and Brazilian membership in the BRICS and the G20 simply underscores the special nature of China’s strengthening political ties with Brazil.
4. Dependence is Relative Our index does not include non-commodity exports or exports to countries other than China. A wider index, however, would probably show that Brazil, Chile, Peru and Argentina’s trade dependence on China is less startling than it appears. For instance, emerging Asian economies rely heavily on external demand. China, Korea and Taiwan are cases in point where exports to GDP share ranges from 30% up to 50%. Another interesting case is Mexico where the share has been increasing in the last 10 years, reaching almost 30%. At the same time, any given country’s concentration of trade flows with a specific partner depends on many factors, of which geography is often the key. The cases of Canada and Mexico where trade flows with the US are almost 80% of their total exports provide a clear demonstration. The recent global crisis has shown the risks associated with concentrating almost all trade flows in one partner. Nevertheless, there are also big advantages when the most important partner is the largest or second largest economy in the world. That does not change the fact that South American commodity exporters are heavily and increasingly dependent on Chinese demand. One question, however, remains: how dependent are South American economies on Chinese commodity demand? The fact that China imports a lot of soybeans from Brazil, for example, does not necessarily mean that Brazil is economically dependent on those exports. South American commodity exporters are highly dependent on China for trade, but their countries’ overall GDP growth rates are far less dependent on China than these high export figures might imply. Exports to China are worth less than 2% of GDP in both Brazil and Argentina. This reflects the fact that trade plays a relatively small role in the Brazilian and Argentinean economies, which have relatively low export-to-GDP ratios at around 9% and 18%, respectively (See Charts 12 and 13 below). This is true for most major Latin American countries apart from Chile, where exports comprise one-third of GDP. Moreover, as Chart 1 demonstrates, copper exports comprise the vast majority of the country’s exports to China. This explains why Chile’s exports to China are worth a much more significant 9% of GDP.
5: In 2010 South African exports of ores of non ferrous metals were less than 6% of its total exports. T
T
Page 10
Working Paper Hong Kong, January 2013
Chart 12
Chart 13
Total exports (% of GDP)
Exports to China (% of GDP)
45%
9%
40%
8%
35%
7%
30%
6%
25%
5%
20%
4%
15%
3%
10%
2%
5%
1%
Argentina
Brazil
Chile
Peru
Source: UN Comtrade and Haver
0%
1993 1994 1995 1996 1997 1998 1999 2000 2001 2002 2003 2004 2005 2006 2007 2008 2009 2010
1993 1994 1995 1996 1997 1998 1999 2000 2001 2002 2003 2004 2005 2006 2007 2008 2009 2010
0%
Argentina
Brazil
Chile
Peru
Source: UN Comtrade and Haver
Calculating the impact of commodity exports on economic growth is complicated. One way is simply to take the contribution made by commodity export revenues, which requires adding the direct value of exports to an estimation of the rise in commodity prices accounted for by the increase in Chinese demand. Based on work done by Professor Rhys Jenkins of the University of East Anglia, who studied China’s effect on the prices of commodity exports for a number of Latin American countries, we estimate that Chinese demand directly contributed just 0.34 percentage points to annual GDP growth in Chile, 0.05 points in Brazil and 0.02 points in Argentina between 2002 and 2007. Of course, the indirect contribution from employment, investment and taxes might be higher – but the overall point stands: even among South America’s commodity-rich exporters to China, overall GDP growth is less directly dependent on China than many might believe. Chart 14
Export dependency (% of GDP in 2010) 40 35 30 25 20 15 10 5 0 Chile share to CN
Argentina
Peru
Brazil
share to ROW
Source: UN Comtrade and Haver
Page 11
Working Paper Hong Kong, January 2013
5. Analysis: Perceptions and Commodities as Growth Engines In fact, export-to-GDP ratios appear to be falling across Latin America, indicating that countries such as Brazil, Chile, Peru and Argentina are becoming less economically dependent on commodity exports, even as soy, iron ore, copper and ores of non ferrous metals exports to China continue to grow. This trend is partially a consequence of the global financial crisis, but also signals the significant role domestic demand has played in the South America’s recent economic expansion. This simply underscores that much of the region’s economic dynamism of recent years has mostly been a function of domestic factors. If Latin American economies are less reliant on Chinese demand than is the common perception, then the natural corollary to this claim is that praise for China’s role as a “savior” of South America from the worse ravages of the global financial crisis may also be overblown. If, as we have shown, South America is only minimally exposed to “export dependence” on China in terms of overall GDP growth rates, why do we see a continuing (and often contradictory) combination of extreme anxieties and hopes about South America’s economic ties to China? Certainly, as we have argued, part of the answer is tied to the prominent role of commodity exports as a driver of booming regional exports to China (see Table 2). Moreover, commodity-driven boom and bust cycles continue to play a prominent role in the historical memories of many South American counties. South American commodity abundance, especially in the four countries analyzed here, provides the foundation of trade relations with China, and is also the focus of China’s increasing investment in countries like Brazil. Seemingly out of the blue, China has risen to become the number one or two trade partner with countries like Argentina, Brazil, Chile and Peru, all on the back of Chinese demand for commodities like soy, iron ore, copper and ores of non ferrous metals. Table 2
South American exports of soy, iron ore, copper and ores of non ferrous metals Soybean
Argentina Brazil Iron Ore
Brazil
Copper
Chile
Peru
Ores non ferrous
Chile
Peru
% of total exports
7.5
5.6
% of total exports
14.8
% of total exports
38.9
11.2
% of total exports
21.7
34.4
commodity exports to China as % of total exports to China
71.0
23.2
commodity exports to China as % of total exports to China
43.4
commodity exports to China as % of 60.4 total exports to China
11.7
commodity exports to China as % of total exports to China
22.7
54.9
64.6
commodity exports to China as % of total commodity exports
46.1
commodity exports to China as % of 38.7 total commodity exports
20.6
commodity exports to China as % of total commodity exports
26.1
31.6
commodity exports to China as % of total commodity exports
82.6
Source: UN Comtrade
Therefore, the hopes and anxieties of this decade-long boom in economic relations with China are really pinned on China’s commodity demand. The unexciting finding that Chinese demand for such commodities may only be responsible for a very minor contribution to GDP growth in these countries thus seems to have been overshadowed by the combination of excitement and anxiety that has accompanied China’s arrival on the scene as a major new economic partner for the region. It may be the relative rise to the prominence of China as a major export destination that has capture the attention, including praise and anxiety, of the region. The second factor beyond this “expectations effect” is that even if South American commodity dependence on China is exaggerated in terms of its perceived negative or positive influence on economic growth in the region, there are secondary effects from the production and export of
Page 12
Working Paper Hong Kong, January 2013
these commodities not fully captured by the statistics. For any given commodity, there are likely to be spin-off effects in that for any given country, one or two commodities may function as an important engine driving the domestic economy. This may be clearest in the case of Chile where copper has long played a central role in the country’s mining and export sector. As the dramatic Chilean mine rescue in 2010 also demonstrated, the country’s mining workers play a central role in the nation’s political and economic identity. Copper production and trade is a key engine of growth, employment and public revenue and it is also the foundation of Chile’s booming trade relationship with China. Booming copper exports to China, especially when prices are high, have a broad-ranging influence on the economy beyond just the copper sector. In turn, any downturn in copper demand, especially if tied directly to China, would have negative implications beyond the marginal effect on GDP growth that we have calculated here. Thus, the combination of hopes and anxieties tied to South America’s decade-long boom in economic relations with China is likely to persist. The honeymoon period of South America China economic relations may or may not be over, but what is clear is that commodities will continue to underpin the relationship for better or for worse.
Page 13
Working Paper Hong Kong, January 2013
Working Papers 2013 13/01 Hugo Perea, David Tuesta y Alfonso Ugarte: Lineamientos para impulsar el Crédito y el Ahorro. Perú. 13/02 Ángel de la Fuente: A mixed splicing procedure for economic time series. 13/03 Ángel de la Fuente: El sistema de financiación regional: la liquidación de 2010 y algunas reflexiones sobre la reciente reforma. 13/04 Santiago Fernández de Lis, Adriana Haring, Gloria Sorensen, David Tuesta, Alfonso Ugarte: Lineamientos para impulsar el proceso de profundización bancaria en Uruguay. 13/05 Matt Ferchen, Alicia Garcia-Herrero and Mario Nigrinis: Evaluating Latin America’s Commodity Dependence on China.
2012 12/01 Marcos Dal Bianco, Máximo Camacho and Gabriel Pérez-Quiros: Short-run forecasting of the euro-dollar exchange rate with economic fundamentals. 12/02 Guoying Deng, Zhigang Li and Guangliang Ye: Mortgage Rate and the Choice of Mortgage Length: Quasi-experimental Evidence from Chinese Transaction-level Data. 12/03 George Chouliarakis and Mónica Correa-López: A Fair Wage Model of Unemployment with Inertia in Fairness Perceptions. 12/04 Nathalie Aminian, K.C. Fung, Alicia García-Herrero, Francis NG: Trade in services: East Asian and Latin American Experiences. 12/05 Javier Alonso, Miguel Angel Caballero, Li Hui, María Claudia Llanes, David Tuesta, Yuwei Hu and Yun Cao: Potential outcomes of private pension developments in China (Chinese Version). 12/06 Alicia Garcia-Herrero, Yingyi Tsai and Xia Le: RMB Internationalization: What is in for Taiwan?. 12/07 K.C. Fung, Alicia Garcia-Herrero, Mario Nigrinis Ospina: Latin American Commodity Export Concentration: Is There a China Effect?. 12/08 Matt Ferchen, Alicia Garcia-Herrero and Mario Nigrinis: Evaluating Latin America’s Commodity Dependence on China. 12/09 Zhigang Li, Xiaohua Yu, Yinchu Zeng and Rainer Holst: Estimating transport costs and trade barriers in China: Direct evidence from Chinese agricultural traders. 12/10 Maximo Camacho and Jaime Martinez-Martin: Forecasting US GDP from small-scale factor models in real time. 12/11 J.E. Boscá, R. Doménech and J. Ferria: Fiscal Devaluations in EMU. 12/12 Ángel de la Fuente and Rafael Doménech: The financial impact of Spanish pension reform: A quick estimate. 12/13 Biliana Alexandrova-Kabadjova, Sara G. Castellanos Pascacio, Alma L. GarcíaAlmanza: The Adoption Process of Payment Cards -An Agent- Based Approach . 12/14 Biliana Alexandrova-Kabadjova, Sara G. Castellanos Pascacio, Alma L. GarcíaAlmanza: El proceso de adopción de tarjetas de pago: un enfoque basado en agentes. 12/15 Sara G. Castellanos, F. Javier Morales y Mariana A. Torán: Análisis del uso de servicios financieros por parte de las empresas en México: ¿Qué nos dice el Censo Económico 2009?
Page 14
Working Paper Hong Kong, January 2013
12/16 Sara G. Castellanos, F. Javier Morales y Mariana A. Torán: Analysis of the Use of Financial Services by Companies in Mexico: What does the 2009 Economic Census tell us? 12/17 R. Doménech: Las Perspectivas de la Economía Española en 2012: 12/18 Chen Shiyuan, Zhou Yinggang: Revelation of the bond market (Chinese version). 12/19 Zhouying Gang, Chen Shiyuan: On the development strategy of the government bond market in China (Chinese version). 12/20 Angel de la Fuente and Rafael Doménech: Educational Attainment in the OECD, 19602010. 12/21 Ángel de la Fuente: Series enlazadas de los principales agregados nacionales de la EPA, 1964-2009. 12/22 Santiago Fernández de Lis and Alicia Garcia-Herrero: Dynamic provisioning: a buffer rather than a countercyclical tool?. 12/23 Ángel de la Fuente: El nuevo sistema de financiación de las Comunidades Autónomas de régimen común: un análisis crítico y datos homogéneos para 2009 y 2010. 12/24 Beatriz Irene Balmaseda Pérez y Lizbeth Necoechea Hasfield: Metodología de estimación del número de clientes del Sistema Bancario en México. 12/25 Ángel de la Fuente: Series enlazadas de empleo y VAB para España, 1955-2010. 12/26 Oscar Arce, José Manuel Campa y Ángel Gavilán: Macroeconomic Adjustment under Loose Financing Conditions in the Construction Sector. 12/27 Ángel de la Fuente: Algunas propuestas para la reforma del sistema de financiación de las comunidades autónomas de régimen común. 12/28 Amparo Castelló-Climent, Rafael Doménech: Human Capital and Income Inequality: Some Facts and Some Puzzles. 12/29 Mónica Correa-López y Rafael Doménech: La Internacionalización de las Empresas Españolas. 12/30 Mónica Correa-López y Rafael Doménech: The Internationalisation of Spanish Firms. 12/31 Robert Holzmann, Richard Hinz and David Tuesta: Early Lessons from Country Experience with Matching Contribution Schemes for Pensions. 12/32 Luis Carranza, Ángel Melguizo and David Tuesta: Matching Contributions for Pensions in Colombia, Mexico, and Peru: Experiences and Prospects. 12/34 Luis Carranza, Ángel Melguizo y David Tuesta: Aportaciones compartidas para pensiones en Colombia, México y Perú: Experiencias y perspectivas.
2011 11/01 Alicia García Herrero: Hong Kong as international banking center: present and future. 11/02 Arnoldo López-Marmolejo: Effects of a Free Trade Agreement on the Exchange Rate Pass-Through to Import Prices. 11/03 Angel de la Fuente: Human capital and productivity. 11/04 Adolfo Albo y Juan Luis Ordaz Díaz: Los determinantes de la migración y factores de la expulsión de la migración mexicana hacia el exterior, evidencia municipal. 11/05 Adolfo Albo y Juan Luis Ordaz Díaz: La Migración Mexicana hacia los Estados Unidos: Una breve radiografía. 11/06 Adolfo Albo y Juan Luis Ordaz Díaz: El Impacto de las Redes Sociales en los Ingresos de los Mexicanos en EEUU.
Page 15
Working Paper Hong Kong, January 2013
11/07 María Abascal, Luis Carranza, Mayte Ledo y Arnoldo López Marmolejo: Impacto de la Regulación Financiera sobre Países Emergentes. 11/08 María Abascal, Luis Carranza, Mayte Ledo and Arnoldo López Marmolejo: Impact of Financial Regulation on Emerging Countries. 11/09 Angel de la Fuente y Rafael Doménech: El impacto sobre el gasto de la reforma de las pensiones: una primera estimación. 11/10 Juan Yermo: El papel ineludible de las pensiones privadas en los sistemas de ingresos de jubilación. 11/11 Juan Yermo: The unavoidable role of private pensions in retirement income systems. 11/12 Angel de la Fuente and Rafael Doménech: The impact of Spanish pension reform on expenditure: A quick estimate. 11/13 Jaime Martínez-Martín: General Equilibrium Long-Run Determinants for Spanish FDI: A Spatial Panel Data Approach. 11/14 David Tuesta: Una revisión de los sistemas de pensiones en Latinoamérica. 11/15 David Tuesta: A review of the pension systems in Latin America. 11/16 Adolfo Albo y Juan Luis Ordaz Díaz: La Migración en Arizona y los efectos de la Nueva Ley “SB-1070”. 11/17 Adolfo Albo y Juan Luis Ordaz Díaz: Los efectos económicos de la Migración en el país de destino. Los beneficios de la migración mexicana para Estados Unidos. 11/18 Angel de la Fuente: A simple model of aggregate pension expenditure. 11/19 Angel de la Fuente y José E. Boscá: Gasto educativo por regiones y niveles en 2005. 11/20 Máximo Camacho and Agustín García Serrador: The Euro-Sting revisited: PMI versus ESI to obtain euro area GDP forecasts. 11/21 Eduardo Fuentes Corripio: Longevity Risk in Latin America. 11/22 Eduardo Fuentes Corripio: El riesgo de longevidad en Latinoamérica. 11/23 Javier Alonso, Rafael Doménech y David Tuesta: Sistemas Públicos de Pensiones y la Crisis Fiscal en la Zona Euro. Enseñanzas para América Latina. 11/24 Javier Alonso, Rafael Doménech y David Tuesta: Public Pension Systems and the Fiscal Crisis in the Euro Zone. Lessons for Latin America. 11/25 Adolfo Albo y Juan Luis Ordaz Díaz: Migración mexicana altamente calificadaen EEUU y Transferencia de México a Estados Unidos a través del gasto en la educación de los migrantes. 11/26 Adolfo Albo y Juan Luis Ordaz Díaz: Highly qualified Mexican immigrants in the U.S. and transfer of resources to the U.S. through the education costs of Mexican migrants. 11/27 Adolfo Albo y Juan Luis Ordaz Díaz: Migración y Cambio Climático. El caso mexicano. 11/28 Adolfo Albo y Juan Luis Ordaz Díaz: Migration and Climate Change: The Mexican Case. 11/29 Ángel de la Fuente y María Gundín: Indicadores de desempeño educativo regional: metodología y resultados para los cursos 2005-06 a 2007-08. 11/30 Juan Ramón García: Desempleo juvenil en España: causas y soluciones. 11/31 Juan Ramón García: Youth unemployment in Spain: causes and solutions. 11/32 Mónica Correa-López and Beatriz de Blas: International transmission of medium-term technology cycles: Evidence from Spain as a recipient country.
Page 16
Working Paper Hong Kong, January 2013
11/33 Javier Alonso, Miguel Angel Caballero, Li Hui, María Claudia Llanes, David Tuesta, Yuwei Hu and Yun Cao: Potential outcomes of private pension developments in China. 11/34 Javier Alonso, Miguel Angel Caballero, Li Hui, María Claudia Llanes, David Tuesta, Yuwei Hu and Yun Cao: Posibles consecuencias de la evolución de las pensiones privadas en China. 11/35 Enestor Dos Santos: Brazil on the global finance map: an analysis of the development of the Brazilian capital market. 11/36 Enestor Dos Santos, Diego Torres y David Tuesta: Una revisión de los avances en la inversión en infraestructura en Latinoamerica y el papel de los fondos de pensiones privados. 11/37 Enestor Dos Santos, Diego Torres and David Tuesta: A review of recent infrastructure investment in Latin America and the role of private pension funds. 11/ 38 Zhigang Li and Minqin Wu: Estimating the Incidences of the Recent Pension Reform in China: Evidence from 100,000 Manufacturers.
2010 10/01 Carlos Herrera: Rentabilidad de largo plazo y tasas de reemplazo en el Sistema de Pensiones de México. 10/02 Javier Alonso, Jasmina Bjeletic, Carlos Herrera, Soledad Hormazabal, Ivonne Ordóñez, Carolina Romero, David Tuesta and Alfonso Ugarte: Projections of the Impact of Pension Funds on Investment in Infrastructure and Growth in Latin America. 10/03 Javier Alonso, Jasmina Bjeletic, Carlos Herrera, Soledad Hormazabal, Ivonne Ordóñez, Carolina Romero, David Tuesta and Alfonso Ugarte: A balance of Pension Fund Infrastructure Investments: The Experience in Latin America. 10/04 Mónica Correa-López y Ana Cristina Mingorance-Arnáiz: Demografía, Mercado de Trabajo y Tecnología: el Patrón de Crecimiento de Cataluña, 1978-2018. 10/05 Soledad Hormazabal D.: Gobierno Corporativo y Administradoras de Fondos de Pensiones (AFP). El caso chileno. 10/06 Soledad Hormazabal D.: Corporate Governance and Pension Fund Administrators: The Chilean Case. 10/07 Rafael Doménech y Juan Ramón García: ¿Cómo Conseguir que Crezcan la Productividad y el Empleo, y Disminuya el Desequilibrio Exterior?. 10/08 Markus Brückner and Antonio Ciccone: International Commodity Prices, Growth, and the Outbreak of Civil War in Sub-Saharan Africa. 10/09 Antonio Ciccone and Marek Jarocinski: Determinants of Economic Growth: Will Data Tell? 10/10 Antonio Ciccone and Markus Brückner: Rain and the Democratic Window of Opportunity. 10/11 Eduardo Fuentes: Incentivando la cotización voluntaria de los trabajadores independientes a los fondos de pensiones: una aproximación a partir del caso de Chile. 10/12 Eduardo Fuentes: Creating incentives for voluntary contributions to pension funds by independent workers: A primer based on the case of Chile. 10/13 J. Andrés, J.E. Boscá, R. Doménech and J. Ferri: Job Creation in Spain: Productivity Growth, Labour Market Reforms or both. 10/14 Alicia García-Herrero: Dynamic Provisioning: Some lessons from existing experiences. 10/15 Arnoldo López Marmolejo and Fabrizio López-Gallo Dey: Public and Private Liquidity Providers. Page 17
Working Paper Hong Kong, January 2013
10/16 Soledad Zignago: Determinantes del comercio internacional en tiempos de crisis. 10/17 Angel de la Fuente and José Emilio Boscá: EU cohesion aid to Spain: a data set Part I: 2000-06 planning period. 10/18 Angel de la Fuente: Infrastructures and productivity: an updated survey. 10/19 Jasmina Bjeletic, Carlos Herrera, David Tuesta y Javier Alonso: Simulaciones de rentabilidades en la industria de pensiones privadas en el Perú. 10/20 Jasmina Bjeletic, Carlos Herrera, David Tuesta and Javier Alonso: Return Simulations in the Private Pensions Industry in Peru. 10/21 Máximo Camacho and Rafael Doménech: MICA-BBVA: A Factor Model of Economic and Financial Indicators for Short-term GDP Forecasting. 10/22 Enestor Dos Santos and Soledad Zignago: The impact of the emergence of China on Brazilian international trade. 10/23 Javier Alonso, Jasmina Bjeletic y David Tuesta: Elementos que justifican una comisión por saldo administrado en la industria de pensiones privadas en el Perú. 10/24 Javier Alonso, Jasmina Bjeletic y David Tuesta: Reasons to justify fees on assets in the Peruvian private pension sector. 10/25 Mónica Correa-López, Agustín García Serrador and Cristina Mingorance-Arnáiz: Product Market Competition and Inflation Dynamics: Evidence from a Panel of OECD Countries. 10/26 Carlos A. Herrera: Long-term returns and replacement rates in Mexico’s pension system. 10/27 Soledad Hormazábal: Multifondos en el Sistema de Pensiones en Chile. 10/28 Soledad Hormazábal: Multi-funds in the Chilean Pension System. 10/29 Javier Alonso, Carlos Herrera, María Claudia Llanes y David Tuesta: Simulations of long-term returns and replacement rates in the Colombian pension system. 10/30 Javier Alonso, Carlos Herrera, María Claudia Llanes y David Tuesta: Simulaciones de rentabilidades de largo plazo y tasas de reemplazo en el sistema de pensiones de Colombia.
The analysis, opinions, and conclusions included in this document are the property of the authors of the report and are not necessarily property of the BBVA Group.
BBVA Research’s publications can be viewed on the following website: http://www.bbvaresearch.com
Contact details: BBVA Research 10/F Two International Finance Centre 8 Finance Street Central Hong Kong Tel: +852 2582 3111 E-mail:
[email protected]
Page 18